Monitor your application with micrometer and Google Cloud Monitoring
Monitoring is an integral part of modern Site Reliability Engineering practices. In this article, you will learn how to apply monitoring to your application using Micrometer and Google Cloud Monitoring.
Comprehensive application monitoring can include many types of data, including metrics, text logging, structured event logging, distributed tracing, and event introspection. While all of these approaches are useful in their own right, this article mostly addresses metrics. Together with structured logging, these two data sources are best suited to Site Reliability Engineering fundamental monitoring needs.
To be able to judge service or application health and diagnose when something goes wrong we need some sort of visibility into the system. Basing on metrics we can:
- Alert on conditions that require attention.
- Investigate and diagnose those issues.
- Display information about the system visually.
- Gain insight into trends in resource usage or service health for long-term planning.
- Compare the behavior of the system before and after a change, or between two groups in an experiment.
Application preparation
We will start with the simplest Spring Boot application with just one additional dependency:
<!--?xml version="1.0" encoding="UTF-8"?-->
<project xmlns="http://maven.apache.org/POM/4.0.0" xmlns:xsi="http://www.w3.org/2001/XMLSchema-instance" xsi:schemalocation="http://maven.apache.org/POM/4.0.0 https://maven.apache.org/xsd/maven-4.0.0.xsd">
    <modelversion>4.0.0</modelversion>
    <parent>
        <groupid>org.springframework.boot</groupid>
        <artifactid>spring-boot-starter-parent</artifactid>
        <version>2.4.2</version>
        <relativepath> <!-- lookup parent from repository -->
    </relativepath></parent>
    <groupid>com.example</groupid>
    <artifactid>metrics-test</artifactid>
    <version>0.0.1-SNAPSHOT</version>
    <name>metrics-test</name>
    <properties>
        <java.version>11</java.version>
    </properties>
    <dependencies>
        <dependency>
            <groupid>org.springframework.boot</groupid>
            <artifactid>spring-boot-starter-actuator</artifactid>
        </dependency>
        <dependency>
            <groupid>org.springframework.boot</groupid>
            <artifactid>spring-boot-starter-web</artifactid>
        </dependency>
        <dependency>
            <groupid>io.micrometer</groupid>
            <artifactid>micrometer-registry-stackdriver</artifactid>
            <version>${micrometer.version}</version>
        </dependency>
    </dependencies>

    <build>
        <plugins>
            <plugin>
                <groupid>org.springframework.boot</groupid>
                <artifactid>spring-boot-maven-plugin</artifactid>
            </plugin>
        </plugins>
    </build>

</project>
„${micrometer.version}” value will be provided by Spring Boot so you don’t need to define it. When the Micrometer library is found on the classpath it will be automatically configured and will start working out of the box. We can add some additional configuration to fulfill more specific requirements. Put an application.yml file on the top of your resource folder:
server:
  port: 8081
management:
  endpoints:
    web:
      exposure:
        include: health,info,metrics
  metrics:
    web:
      server:
        request:
          autotime:
            percentiles: 0.50,0.90,0.99
            percentiles-histogram: true
    export:
      stackdriver:
        enabled: true
        projectId: metrics-test-303411
    tags:
      application: metrics-test
      environment: dev
In our case exposing „metrics” endpoint from Spring Boot actuators is optional. Metrics will not be pulled from the application by Google Cloud Monitoring but pushed by the application. „autotime.percentiles” and „autotime.percentiles-histogram” will give us more comprehensive statistics. „stackdriver.enabled” property when set to false will disable sending metrics to stackdriver – this might be useful for example for local runs or low-level testing environments.
Tags are the way in which we can distinguish metrics sent from different applications, environments, instances. „tags” is just a key-value map, in the above configuration, there are two tags defined: „application” and „environment” with values „metrics-test” and „dev” respectively.
To be able to observe some interesting metrics we will create an endpoint with artificial delay:
@RestController
public class DelayController {

    private final Random r = new Random();

    @GetMapping("/delayed")
    public ResponseEntity<string> getDelayed() {
        delay();
        return ResponseEntity.ok("OK");
    }

    private void delay() {
        long delay  = 500L;
        while (r.nextBoolean()) {
            delay+=(delay/2);
        }
        try {
            Thread.sleep(delay);
        } catch (InterruptedException e) {
            e.printStackTrace();
        }
    }
}
When running in managed environments such as Google App Engine, you don’t need to configure anything more. In those environments the Service Account is automatically associated with the application instance. The underlying Stackdriver Monitoring client library can automatically detect and use those credentials. For a local run, it will be necessary to prepare the Service Account and allow it to write metrics. That leads us to:
Google Cloud Project preparation
You can use an existing project or create a new one just for this exercise. If you decide to create a new project then „Stackdriver Monitoring API” should be enabled. If you are not sure – you can verify this in the web console: https://console.cloud.google.com/apis/library/monitoring.googleapis.com. If API is disabled – enable it.
The next step will be to create a Service Account that we use for our local run:
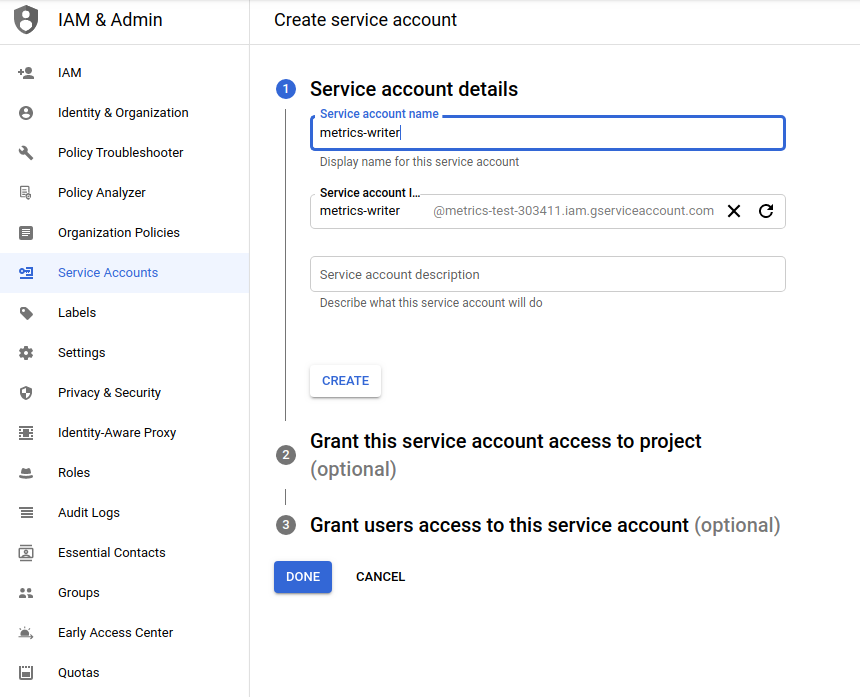
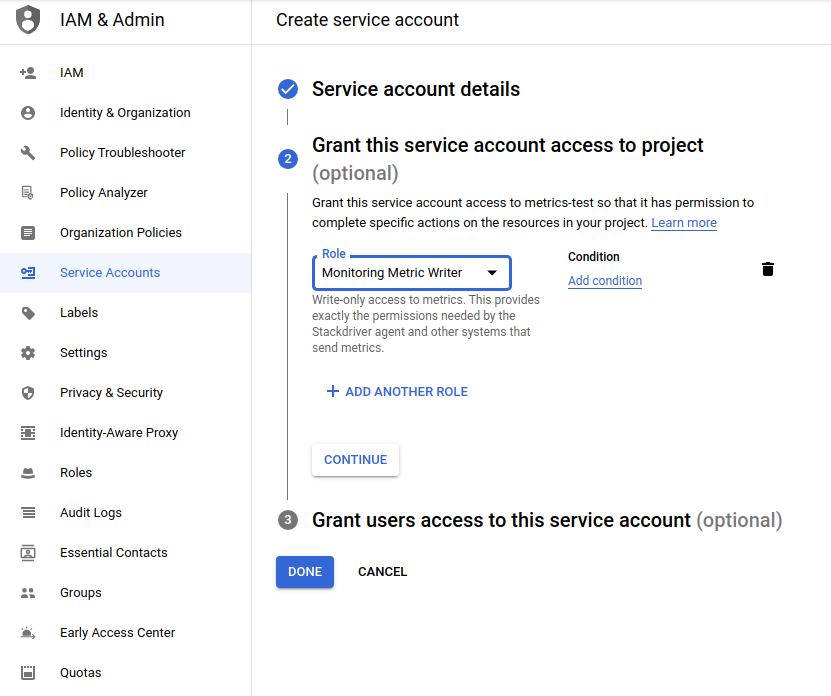
When creating an account don’t forget about granting the „Monitoring Metric Writer” role otherwise, you will not be able to write metrics.
After the account is created we can create and download the credentials key and store it locally in a safe location:
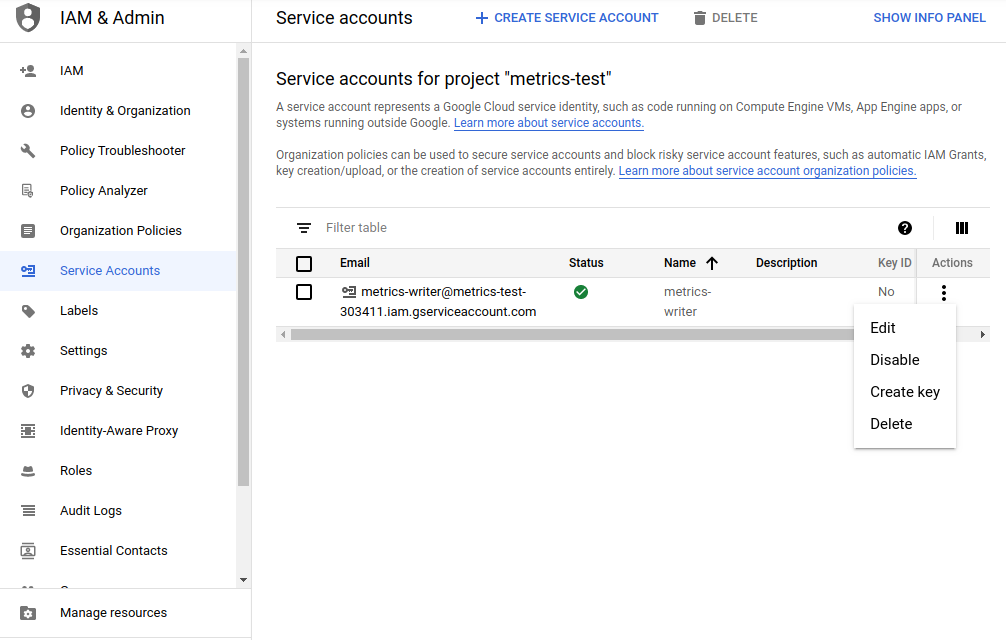
If not configured in another way, the stackdriver client used by our application will search for the „GOOGLE _ APPLICATION _ CREDENTIALS” environment variable which should point to the path where the credentials key is located.
We are now able to run our application. When the application starts we can run also a simple script that will be constantly hitting our endpoint and generating input for our metrics.
#!/usr/bin/env bash

while true;
    do curl http://localhost:8081/delayed
done
Exploring metrics on dashboards
Go to the „Monitoring”, then the „Metrics Explorer” tab. For the first time, a new workspace will be created so it will take around one minute. We can now try to find metrics pushed by our application and create a chart from them.
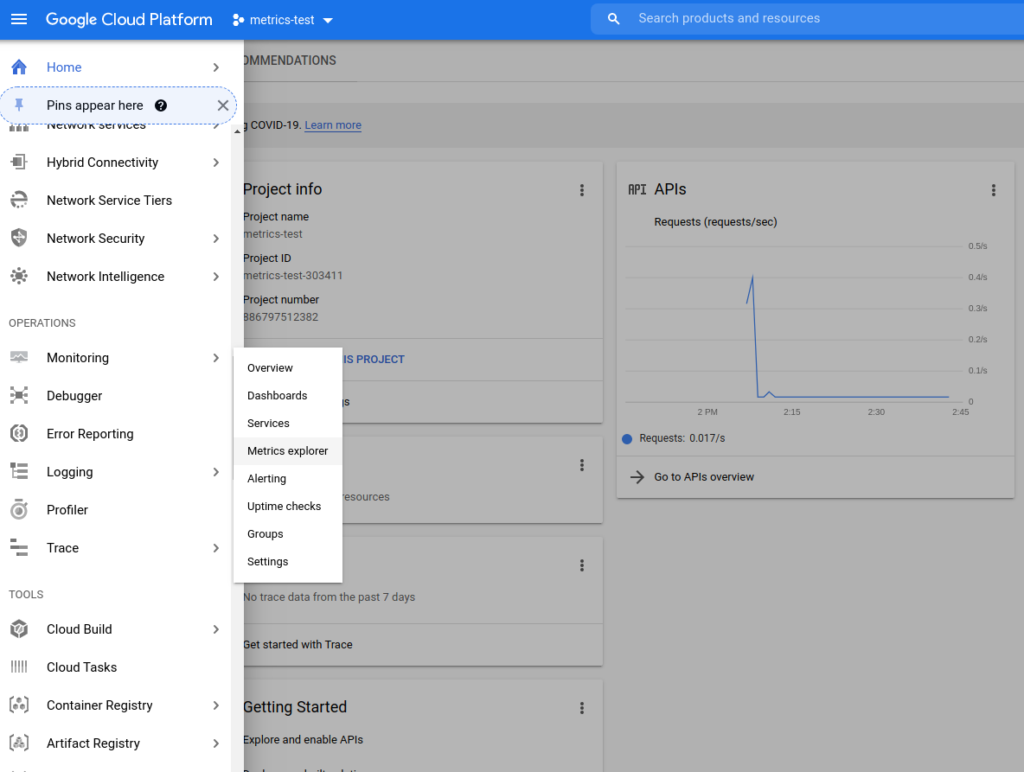
Type resource type Global and search for metrics with names starting from custom.
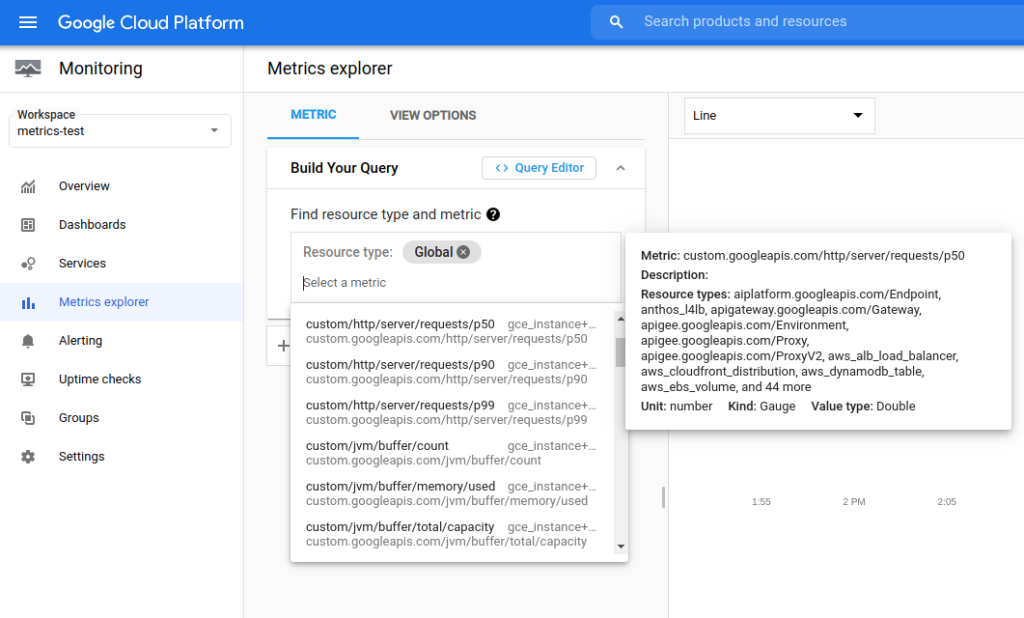
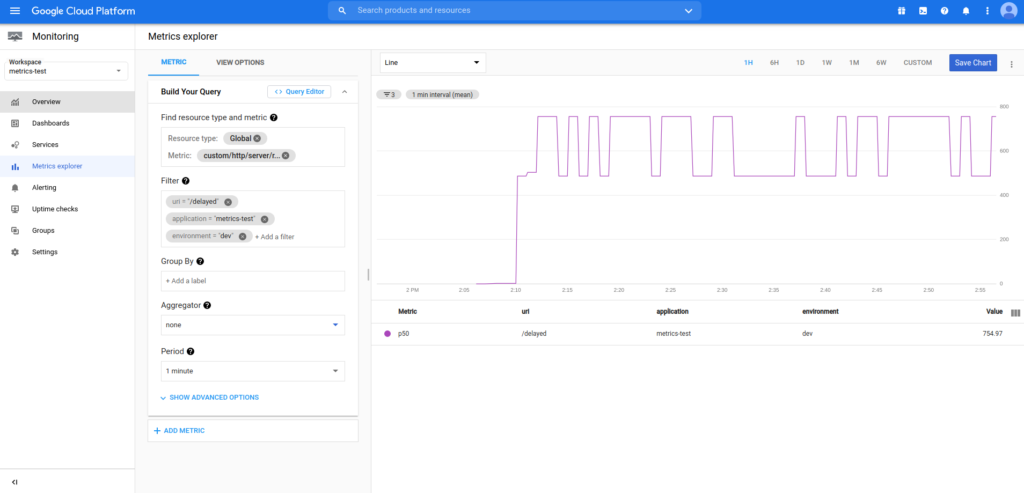
„custom/http/server/requests/p{percentile}” are what is interesting for us now. Pick up the first one and use the filter to limit metrics to only those produced by „/delayed” endpoint and our test application:
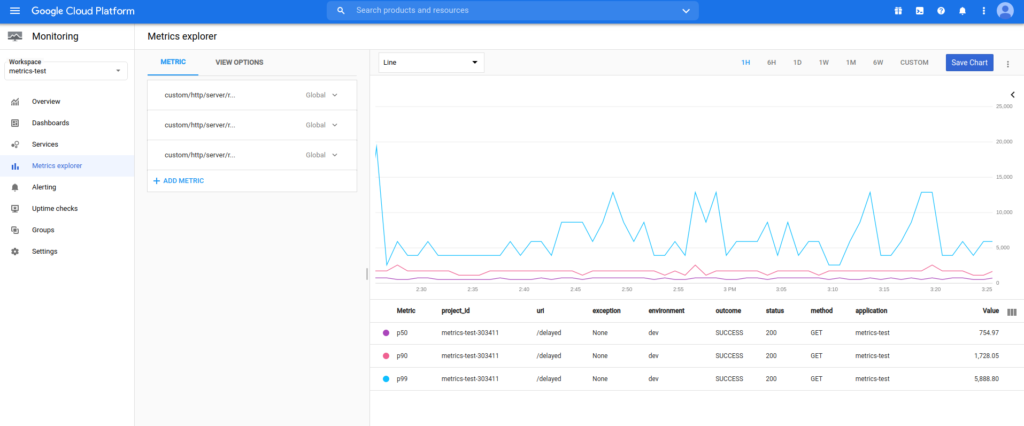
Click on + ADD METRIC and repeat this process for p90 and p99 percentiles:
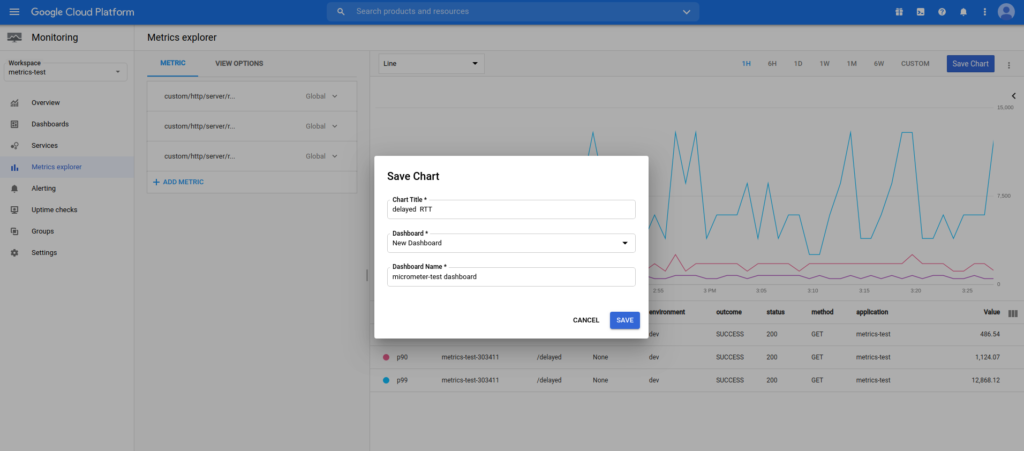
Click on the „Save Chart” button, add a new Dashboard if necessary:
Open Monitoring, then Dashboards, if you cannot see your dashboard yet – reload the page. When you click on your dashboard you should be able to see the chart:
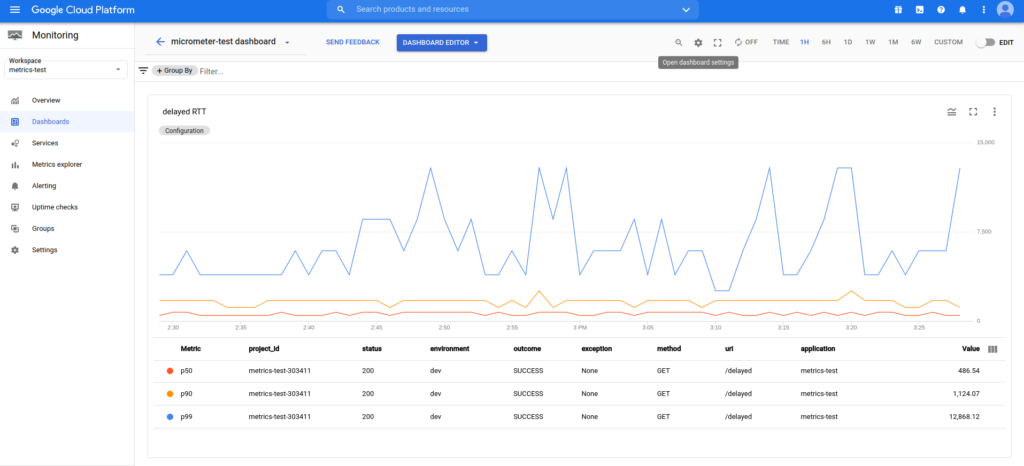
Feel free to play with dashboards and different metrics as well. You can easily add for example a chart displaying JVM memory consumption or any other metric that is pushed by default by the micrometer. Under EDIT toggle on Google Cloud Monitoring, you will find an easy-to-use dashboard editor that will help you to present charts, gauges, and other monitoring related widgets.
Platform limitations
At the moment of writing choosing colors for charts is not supported. You cannot force or change any color, moreover – every person that opens the dashboard might see different colors on the same charts. The only proper way of analyzing charts is to check the chart legend. The micrometer framework strongly relies on platform capability to aggregate datasets. Currently, Google Cloud Monitoring does not support arithmetic operations on metrics (only SUM) so it is not possible to get the difference or ratio of two metrics.
Summary
In this article, we have learned why application monitoring is a crucial part of modern architectures. We have also configured micrometer and Google Cloud monitoring to be able to monitor application performance.
Links
Poznaj mageek of j‑labs i daj się zadziwić, jak może wyglądać praca z j‑People!
Skontaktuj się z nami


